Twenty years after the World Economic Forum (WEF) began measuring the global gender gap, the world is closer to parity than ever. The Global Gender Gap Report 2026 finds the gap is now 69.2% closed across 145 economies, the highest level on record.¹ At the top of organizations, however, progress has stalled for a fourth consecutive year.²
That contrast changes how leaders might think about the executive pay gap. Data from 2026 shows that women who become CEO earn pay comparable to men at the median. The larger disparity lies in who reaches the top. Boards and leadership teams need to look beyond compensation to the barriers that affect who advances to leadership.
Women’s representation narrows at specific points on the path to executive leadership, and organizations can act at each one to build a stronger pipeline.
The Pipeline Starts Full, Then Narrows
Women make up roughly half of the global population and 46% of entry-level workers, yet account for 23% of C-suite executives.¹ The WEF calls this halving the “drop to the top.” Drawing on LinkedIn Economic Graph data, the report points to several factors that can shape advancement: the career paths that lead to senior roles, access to sponsorship (senior leaders who use their influence to advocate for someone’s advancement beyond offering advice), how candidates are selected and evaluated and how organizations handle career breaks.³
Among senior individual contributors returning from a full-time parenting break, men are 44% more likely than women to be promoted in their first year back.³
Women are more than four times as likely as men to take a break for full-time parenting (26.5% compared with 6.0%).¹ But the break alone does not explain the gap. Three years after returning from a parenting break, 7.2% of women had moved up in seniority compared with 10.0% of men.¹ Men and women take the same break and see different career outcomes.
The drop also varies by industry. It is steepest in supply chain and transportation, infrastructure and real estate, where women’s representation falls by 55% or more. Consumer services and education see the smallest declines, at roughly one-third.¹
TABLE A: Women’s Share of Entry-Level vs. C-Suite Roles, by Industry
| Industry | Entry-level | C-suite | % Change |
|---|---|---|---|
| Supply Chain and Transportation | 35.7% | 15.4% | −56.8% |
| Infrastructure | 29.0% | 12.6% | −56.6% |
| Real Estate | 48.7% | 21.9% | −55.0% |
| Technology, Information and Media | 38.9% | 17.6% | −54.8% |
| Financial Services | 47.8% | 22.3% | −53.3% |
| Wholesale | 37.9% | 17.7% | −53.3% |
| Manufacturing | 37.7% | 17.8% | −52.7% |
| Oil, Gas and Mining | 29.5% | 14.5% | −50.7% |
| Cross-industry average | 46.0% | 23.0% | −50.0% |
| Professional Services | 46.8% | 23.6% | −49.4% |
| Utilities | 36.2% | 18.4% | −49.2% |
| Entertainment Providers | 47.5% | 27.0% | −43.1% |
| Accommodation and Food | 46.4% | 26.4% | −43.1% |
| Healthcare and Care Services | 64.1% | 36.7% | −42.7% |
| Administrative and Support Services | 49.4% | 28.3% | −42.6% |
| Government and Public Sector | 53.4% | 31.6% | −40.9% |
| Retail | 50.6% | 30.3% | −40.2% |
| Education | 56.4% | 36.5% | −35.4% |
| Consumer Services | 56.1% | 37.1% | −33.9% |
Table A note: Including observations up to end of June 2026. Values refer to the unweighted average of 57 economies: Argentina, Australia, Austria, Bahamas, Bahrain, Bangladesh, Barbados, Belgium, Bolivia (Plurinational State of), Brazil, Canada, Chile, Colombia, Cyprus, Czechia, Denmark, Dominican Republic, Ecuador, Egypt, France, Germany, Ghana, Guatemala, Hong Kong SAR, China, India, Ireland, Israel, Italy, Jamaica, Jordan, Kenya, Luxembourg, Malta, Mexico, Morocco, Nepal, Netherlands, New Zealand, Norway, Pakistan, Panama, Peru, Philippines, Poland, Puerto Rico, Romania, Singapore, Spain, Sweden, Switzerland, Türkiye, Ukraine, United Arab Emirates, United Kingdom, United States of America, Uruguay and Venezuela, Bolivarian Republic of. Source: LinkedIn Economic Graph Research Institute.¹
In July 2026, Karen S. Carter became Dow’s CEO, the first woman and first person of color to lead the company. Her path led through HR. She served as CHRO from 2019 to 2022, then led Dow’s largest business, Packaging & Specialty Plastics, before becoming COO. Her career shows the CHRO seat can be a step toward the CEO role when it is paired with profit and loss (P&L) and operating responsibility.
Industry is one part of the picture. The functions women hold within the C-suite also matter, because not all executive roles offer the same visibility, responsibilities or perceived path to the CEO seat.
Women hold 65% of chief people officer roles, 64% of chief human resources officer (CHRO) roles and 45% of chief marketing officer (CMO) roles. Their representation drops to 27% among chief financial officers (CFOs), 24% among chief operating officers (COOs) and 19% among CEOs.³ Among chief technology officers, it falls to 8.6%.¹
This distribution reflects both who reaches the C-suite and which roles are viewed as pathways to the CEO seat. Boards have traditionally treated CFO and COO roles as the proving ground for CEO readiness because those leaders visibly own financial performance and operations. Today’s CHROs and CMOs are expected to bring that same fluency, along with responsibility for talent, culture, customers and growth, yet boards that define readiness too narrowly rarely see them as successors.
Women’s lower representation in finance and operations leadership may reflect both career choices and structural barriers. Experience alone does not close the gap. Among executives who have held roles that typically lead to the top job, such as CFO or COO, women are less likely than men to be named CEO.¹ Access to P&L responsibility, sponsorship and career development can shape who boards see as ready for the role as much as capability does.
The Pay Gap Widens as Careers Advance
Representation is only one dimension of the gap. Compensation offers another perspective on how gender disparities evolve over a career, from differences in earnings across the workforce to who reaches the highest-paid leadership positions.
In the United States, women working full-time and year-round earned 84 cents for every dollar men earned in 2025, according to a Center for American Progress (CAP) analysis of Census data.⁴ That represents a 3-cent improvement from 2024. At the current rate of progress, however, CAP projects that the gender pay gap will not close until 2071.
The pay gap also varies across career stages. Glassdoor’s 2026 Beyond the Gap report finds a 12% gap at the start of a career, 19% after 10 years and 25% after 30 years.⁵ Among executives, Payscale’s 2026 report finds women earn 69 cents for every dollar earned by men on an uncontrolled basis.⁶
At the top, the picture changes. The Conference Board reports that median 2026 pay for an S&P 500 CEO is $17.8 million for women and $17.5 million for men. Yet women hold 9.3% of those CEO roles.⁷
At the CEO level, then, the bigger disparity is representation, and that gap opens years before anyone is considered for the top job.
Progress at the Top Has Stalled
Between 2015 and 2020, the leadership gap was on track to close within 50 years, according to the WEF report. At the current pace, parity would take an estimated 90 years.³
Women’s share of new hires into top-level management has fallen every year since 2022, from 34.8% to 32.3% in the first half of 2026.² Their share of new C-suite hires has stalled around 27% since 2022, after rising from 20.2% in 2015.⁸
The larger the company, the smaller women’s share of CEO roles. Women hold 19% of CEO roles overall,¹ compared with 6.8% at Fortune Global 500 companies, where a record 34 women now lead.⁹
Taken together, these patterns show that a full entry-level pipeline does not guarantee progress at the top. Advancement depends on who gains high-impact experience and who is considered ready for greater responsibility.
CHART B: Women’s Share of the Workforce vs. Top-Level Management, 2015–2026
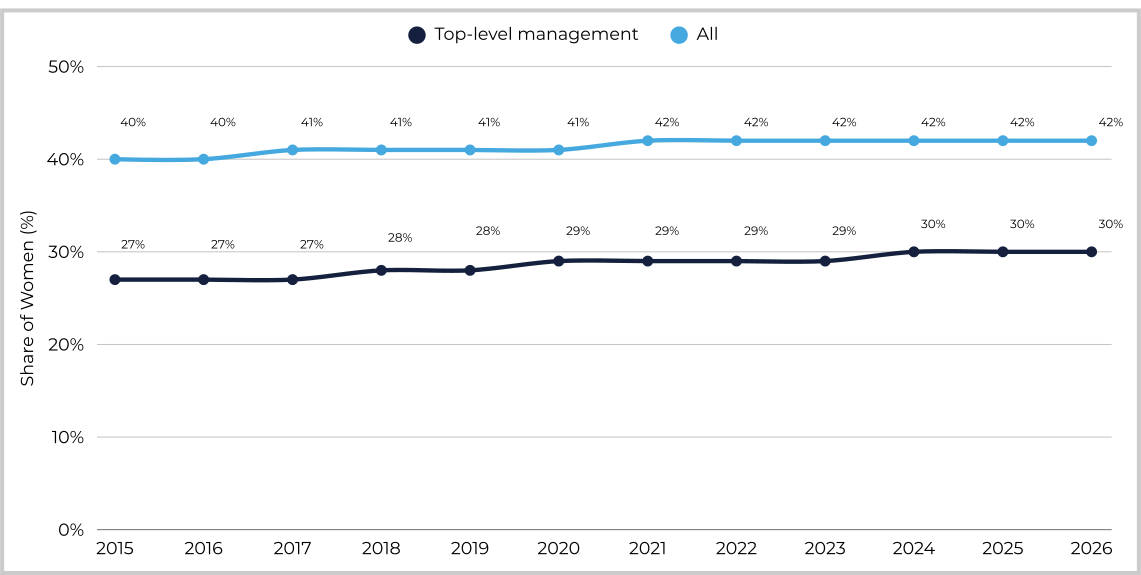
Chart B note: Values refer to the unweighted average of 62 economies: Argentina, Australia, Austria, Bahamas, Bahrain, Bangladesh, Barbados, Belgium, Bolivia (Plurinational State of), Brazil, Canada, Chile, Colombia, Costa Rica, Croatia, Cyprus, Czechia, Denmark, Dominican Republic, Ecuador, Egypt, France, Germany, Ghana, Guatemala, Hong Kong SAR, China, India, Ireland, Israel, Italy, Jamaica, Jordan, Kenya, Luxembourg, Malta, Mexico, Morocco, Nepal, Netherlands, New Zealand, Norway, Pakistan, Panama, Peru, Philippines, Poland, Portugal, Puerto Rico, Qatar, Romania, Singapore, Spain, Sweden, Switzerland, Trinidad and Tobago, Türkiye, Ukraine, United Arab Emirates, United Kingdom, United States of America, Uruguay and Venezuela, Bolivarian Republic of. Source: LinkedIn Economic Graph Research Institute, via WEF Global Gender Gap Report 2026, Figure 2.1.¹
Steps Leadership Teams Can Take
Aggregate data cannot explain the causes within any particular organization. Those answers often lie in everyday talent decisions, from who gets key assignments to who is put forward for promotion.
Boards and leadership teams can act on these findings in several ways:
- Track who receives visible, high-stakes assignments that build readiness for operating roles, including roles with P&L responsibility.
- Ensure women have sponsors who advocate for them when senior opportunities arise, in addition to mentors who offer advice.
- Define readiness to include broad, cross-functional experience and demonstrated business results alongside traditional, linear career paths.
- Evaluate career breaks fairly in promotion and succession decisions.
- Measure representation at every level and assign clear accountability for progress.
Some employers are also adopting skills-based hiring, which evaluates candidates on demonstrated capabilities rather than job titles or degrees. LinkedIn reports that this approach can increase the share of women in candidate pools by 24%.³
The Role of Executive Search
At Slayton Search Partners, our work with boards, CEOs and leadership teams gives us a firsthand view of how these pipeline decisions shape executive search. By the time a C-suite search begins, years of decisions about development, sponsorship and access to opportunity have already influenced the candidate pool.
Our role is to help clients assess executive capability, evaluate leadership experience and identify candidates who can meet the demands of the position. That includes looking beyond titles and traditional career paths while benchmarking executive compensation to support informed decisions.
SOURCES
¹ World Economic Forum, “Global Gender Gap Report 2026,” September 16, 2026 (WEF) | ² World Economic Forum, “Twenty Years of Progress on Gender Parity Now Fragile, WEF Report Finds,” September 16, 2026 (WEF) | ³ Sue Duke, “Women’s leadership is missing in the jobs shaping tomorrow’s economy, leaving economic opportunity on the table,” September 16, 2026 (WEF) | ⁴ Center for American Progress, “New CAP Analysis Finds Gender Wage Gap Narrowed in 2025, While Affordability Challenges Deepen for Women,” September 15, 2026 (Center for American Progress) | ⁵ Stacia Doss and Chris Martin, “Beyond the Gap 2026: Redefining career success & compensation for women,” March 3, 2026 (Glassdoor) | ⁶ Payscale, “Payscale Report Finds Gender Pay Gap Widens in 2026, Exposing Retention, Talent, and Operational Risks for Employers,” March 24, 2026 (Payscale) | ⁷ The Conference Board, “Report: Equity Awards Drive Growth in S&P 500 CEO Compensation,” September 24, 2026 (The Conference Board) | ⁸ Yanjun Guo and Julia Hakspiel, “Gender parity in senior leadership: progress at a turning point,” June 18, 2026 (WEF) | ⁹ Emma Hinchliffe, “A record 34 women now run Fortune Global 500 companies. That’s still just 6.8%,” August 3, 2026 (Fortune)
Contributor